Load Testing Rails Apps with Apache Bench, Siege, and JMeter
Your app works great in development and in production with dozens of users. Now, the marketing team wants to send out a blast: can the app handle hundreds? Thousands? How many users can it handle? These are tricky questions to parse, let alone answer, but any answer is going to involve some form of load testing.
This post will introduce the primary kinds of load testing, their methods and goals, and get you up-and-running with three popular load testing tools, each with their own strengths and weaknesses. Let’s get started!
Terminology: Load Testing, Performance Testing, and Stress Testing
While their methods overlap somewhat, there are three ways and reasons you might be doing this kind of testing:
Performance Benchmarking
What it is: Testing a system under certain reproducible conditions
Why do it: To establish a baseline which can be tested against regularly to ensure a system’s performance remains constant, or validate improvements as a result of change
Answers the question: “How is my app performing, and how does that compare with the past?”
Load testing
What it is: Increasing load on a system to mimic real-world conditions.
Why do it: To reveal potential problems in a system which may appear only when the system is stressed (e.g. memory leaks, race conditions)
Answers the question: “How does my app’s behavior change with a lot of users?”
Stress testing
What it is: Increasing the load on a system beyond what it can handle
Why do it: To test how a system fails when overwhelmed ensure that it fails and recovers gracefully
Answers the question: “What happens when my app gets swamped?”
For further reading on the kinds of load testing, check out this article on the Agile Testing blog.
Can I Do Load Testing in Development?
While it’s possible, there are some good reasons why you shouldn’t.
- It introduces too many variables. Consistency is key when doing any kind of meausrement, and your laptop just isn’t isolated. Things like how long your computer’s been running or even the temperature in the room can affect its ability both to generate and respond to traffic.
- It’s likely a very different environment from production—especially if the OS is different. The ultimate goal of testing is to learn things about how your production app behaves, so the system under test should be as similar as possible.
- There’s an unhelpful feedback loop when the system doing the testing is the same one being tested. It takes a non-trivial amount of processing power to generate the HTTP requests that comprise a load test, and if your laptop is struggling to respond to that traffic, it’ll also struggle to generate that traffic, leading to inconsistent results at volume.
For these reasons, I recommend load testing against a staging environment as similar to the production environment as possible. It’s also common to do load testing against a production environment during off-peak hours.
Getting Started with Apache Bench
Originally designed for testing Apache configurations, Apache Bench is a powerful, flexible tool for generating a flood of HTTP requests and reporting on their results. It comes standard on most Mac and Linux computers (Windows users can find ab.exe packaged as part of a standard Apache installation). A simple load test with Apache Bench looks like this:
$ ab -n 100 -c 10 -l http://beta.stevegrossi.com/on
This benchmark will simulate 100 total requests (the -n flag, for number), ten at a time (the -c flag, for concurrency), to the staging environment of my personal blog. (The -l flag tells Apache Bench not to count a request as failed when its response isn’t exactly the same length as the first request, which is common with dynamic websites.) After several seconds of making those requests, this command returns a report:
Concurrency Level:      10
Time taken for tests:   11.582 seconds
Complete requests:      100
Failed requests:        0
Total transferred:      1691256 bytes
HTML transferred:       1618056 bytes
Requests per second:    8.63 [#/sec] (mean)
Time per request:       1158.245 [ms] (mean)
Time per request:       115.824 [ms] (mean, across all concurrent requests)
Transfer rate:          142.60 [Kbytes/sec] received
This gives us some useful benchmarks, especially requests per second and average time per request. It took me some digging to learn the difference between the two “Time per request” values. The first is the average time it takes to complete a single request in isolation. This mimics the response time from a user’s point of view: how long it takes before they’ve downloaded the page. The second, the “mean across all concurrent requests” is the first value divided by the concurrency, and approximates how long from the server’s point of view it would takes to process an additional request (i.e. changing -n from 100 to 101). Chances are, you’ll want to keep an eye on both, though I find the former easier to reason about.
The next section of the report shows details about the request timing: minimum, maximum, mean, and median response times, along with the standard deviation (more on that later)
Connection Times (ms)
              min  mean [+/-sd] median   max
Connect:       52  100   85.4     58     393
Processing:   365 1014  1165.7    721    8057
Waiting:      245  915  1144.1    642    7887
Total:        420 1114  1167.5    790    8112
Connect is how long it took to establish a connection with the server (i.e. network latency). Processing is the amount of time between sending the first byte of the request and receiving the first byte of the response. And Waiting is the time between the last byte of the request and the first byte of the response (see this blog post for more detail).
A Note on Standard Deviation
When interpreting these results, and especially when making decisions based on them, pay attention to the standard deviation. This is a measure of how widely your results tend to vary from the average. The smaller the standard deviation, the more consistent your results are. Under normal operation, a web server should be fairly consistent in how long it takes to fulfill requests, so a large standard deviation is a sign you may be pushing the server too hard (as I was likely doing in this example, with a standard deviation larger than the mean). Think of it as “The average request got a response within 1114ms, give or take 1167ms.”
You want a low standard deviation, especially when making decisions based on benchmark data. If your baseline benchmark is a mean response time of 500ms with a large standard deviation of 100ms, and you make a change that reduces the mean response time to 450ms, you can’t be sure that your change explains the positive effect because the degree of reduced latency is smaller than the random variance of the results.
Back to the results from Apache Bench, you’ll finally see a percentile breakdown of response times. Like the standard deviation, this gives you a sense of how consistent your results are.
Percentage of the requests served within a certain time (ms)
  50%    790
  66%    980
  75%   1066
  80%   1198
  90%   1448
  95%   2065
  98%   8111
  99%   8112
 100%   8112 (longest request)
Looking at the results for my benchmark above, I can see that 95% of the results were fairly consistent—between 0 and 2 seconds—but that the rest took over 4 times as long. As with a large standard deviation, large outlier results should be looked into and addressed, as they’re a sign the server (perhaps overloaded) is behaving inconsistently.
Dealing with Authentication
A public blog is one thing, but what about benchmarking a dashboard page that requires you to log in? Happily, Apache Bench has our back here. To test a site that uses simple HTTP authentication, the -A flag with a colon-separated username and password will get you through:
$ ab -n 10 -c 5 -A username:password http://beta.stevegrossi.com/on
But you’re (hopefully) using more sophisticated, session-based authentication, especially with a Rails app. In this case, you’ll just need to give Apache Bench an authenticated cookie to use on your behalf. I’m sure there’s an easier way to do this with cURL, but I find it simplest to use Chrome developer tools to inspect the cookie header sent after I log in. First, log into the website you want to test and open up the dev tools’ Resources tab. Under the Cookies toggle, click the name of your site and you’ll see all of the cookies set by your site. For a Rails site, look for one that looks like _mywebsite_session. You’ll want to copy its value for use in a minute, and to do so, make sure you click on the value three (3) times before copying. The full cookie value may have a newline in it, so just right-clicking it and choosing “Copy” or only clicking twice will not select the entire cookie value, just the first line of it. (This left me stumped for a while.)
To run Apache Bench against a page that requires you to be logged in, simply pass in the -C flag along with the quoted cookie key and value in the format “key=value”, i.e.
$ ab -n 100 -c 10 -C '_stevegrossi_session=BAh7CUkiD3Nlc...' http://beta.stevegrossi.com/meta
So What Do We Do With This Data?
We’ve already got some useful information telling us where we stand: my website’s homepage can handle ten requests at a time, ten times in a row, and return a response within about 1.2 seconds. Now, I can:
- change something, and compare performance to the benchmark
- take regular benchmarks and track them over time to make sure performance doesn’t regress
- use the benchmark itself as test data to observe how the server responds to predictable traffic loads. It’s as simple as opening up New Relic (or your instrumentation of choice) and digging into the time period during one of your benchmarks. I’ll cover that more in the next section.
- Increase the load and do some stres testing
Getting Started with Siege
Siege is a tool similar to Apache Bench, but with a few advantages which I think make it better at simulating real-world traffic loads, though these come at the cost of less robust reporting. The first advantage is that Siege can run against multiple pages on your website in a single test, and the second is that it can introduce a degree of randomness to the timing of the HTTP requests. Our goal in this section will be to simulate real-world traffic to our app and then use a monitoring tool like New Relic to see how the app is behaving from the inside.
Siege can be installed via homebrew ($ brew install siege) on a Mac, and while there’s no official Windows support, there is a port which runs under cygwin.
Siege’s interface is slightly different from Apache Bench. To run the same benchmark as above with Siege (100 requests, 10 at a time) we’d run
$ siege -r 10 -c 10 http://beta.stevegrossi.com/on
(The -r is for repetitions, and is multiplied by the -c concurrency value to get the total number of requests.) You can also tell Siege to run for a particular amount of time with the -t flag, e.g.:
$ siege -c 10 -t 60s http://beta.stevegrossi.com/on
While running, Siege will show you a feed of each request, its status, response time, size, and path:
HTTP/1.1 200   0.60 secs:    5237 bytes ==> GET  /on
HTTP/1.1 200   0.49 secs:    5238 bytes ==> GET  /on
HTTP/1.1 200   0.56 secs:    5241 bytes ==> GET  /on
And at the end, a summary of the result (though lacking in some of Apache Bench’s statistical detail):
Transactions:             100 hits
Availability:             100.00 %
Elapsed time:             18.02 secs
Data transferred:         0.50 MB
Response time:            0.90 secs
Transaction rate:         5.55 trans/sec
Throughput:               0.03 MB/sec
Concurrency:              5.01
Successful transactions:  100
Failed transactions:      0
Longest transaction:      2.31
Shortest transaction:     0.30
Handling Authentication with Siege
Siege can handle HTTP Basic authentication, though differently (and, in my opinion, less conveniently) than Apache Bench. In the simplest case, you have to create a .siegerc file in your home directory with the contents:
login = username:password
Siege will then respond to 401 Authorization Required with the username and password from that configuration file. You can read more about Siege’s HTTP auth support in the documentation.
Siege can also use a cookie to access URLs that require authentication. However, using Siege’s API we’ll need to specify the entire Cookie: header with the -H flag, not just the cookie string itself. It looks like this:
$ siege -r 10 -c 10 -H 'Cookie: _stevegrossi_session=BAh7CUkiD3Nlc...' http://beta.stevegrossi.com/meta
Siege’s Unique Features
For our load test, let’s simulate 25 users browsing beta.stevegrossi.com for a total of 5 minutes, taking advantage of some of Siege’s unique features: testing multiple URLs and introducing a degree of randomness to the requests. Then, we’ll look at how the site performed under load in New Relic.
To test multiple URLs with Siege, you use the -f flag and pass in a text file with each URL on its own line. First, I’ll create a file in the current directory called urls.txt, containing a representative sample of URLs on my personal blog
http://beta.stevegrossi.com/on
http://beta.stevegrossi.com/on/anathem
http://beta.stevegrossi.com/on/books/by/neal-stephenson
http://beta.stevegrossi.com/on/topics/information
I’ll also introduce a random delay of between 1 and 5 seconds (instead of the default 1) between each user’s requests to simulate reading one page before moving on to the next:
$ siege -c 25 -t 5M -d 5 -f urls.txt
While the output from Siege may appear random, each concurrent user is actually requesting the URLs from the text file in order: it’s just that with 25 users at once and the variability in response times, requests complete in essentially random order. But you can be sure that requests to each URL will be evenly distributed.
Inspecting Our App Under Load with New Relic
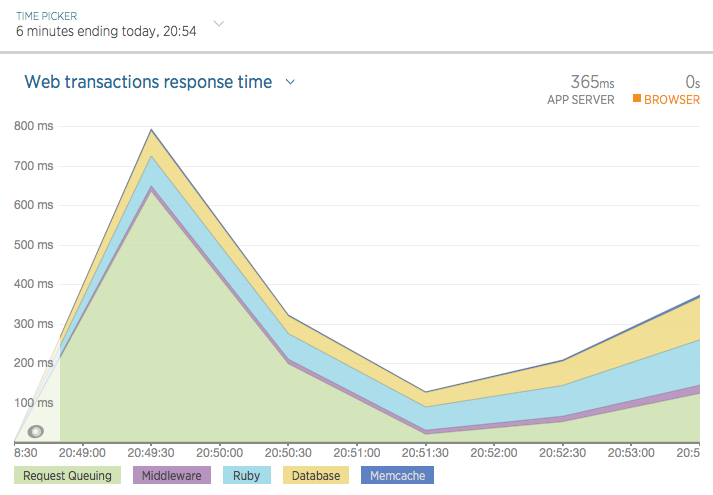
Now that we’ve generated a fair bit of simulated traffic, we can log into New Relic and observe how our app behaved under the traffic load. Within New Relic (after a few minutes), if you’re looking at the default “last 30 minutes” view, you’ll probably see a spike of traffic lasting around 5 minutes. You can zoom in By dragging your mouse to highlight just the revelant section of the chart, isolating it:
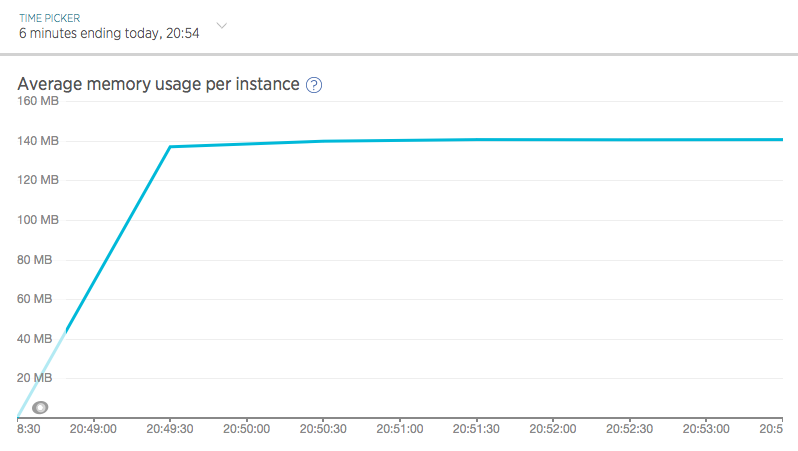
The “Instances” tab can give us information on the app’s memory usage under load:
And the “Transactions” tab can tell us which of the four URLs being tested took up the most time, as well as where in our app’s stack that time was being spent:
In sum, Siege is a great way to simulate real-world traffic to a staging app so we can inspect how the app handled things. This is especially handy before making significant changes or when troubleshooting issues that only arise under load.
Getting Started with Apache JMeter
So, Apache Bench can help us pummel a URL with traffic, even when it’s behind authentication. Siege can do the same, but with multiple URLs and random delays to simulate real users. But what if we want to test multiple users independently logging into and interacting with our app? That’s where Apache JMeter comes in. Like Apache Bench and Siege, JMeter is essentially a tool for generating a flood of HTTP requests, but JMeter can keep track of separate cookies for each concurrent user, let you design robust test plans, and returns a wealth of data that can be parsed with a variety of formatters. JMeter requests will also download linked assets like CSS and JS files by default, which better simulates real users. It’s a heavy-duty tool, but we’ll look at the fairly common use case of logging into and interacting with a Rails app.
Installation and Setup
JMeter requires Java to be installed. After installing that prerequisite, Homebrew users can $ brew install jmeter, or else download it here.
JMeter can be run from the command line, which will open up the JMeter GUI:
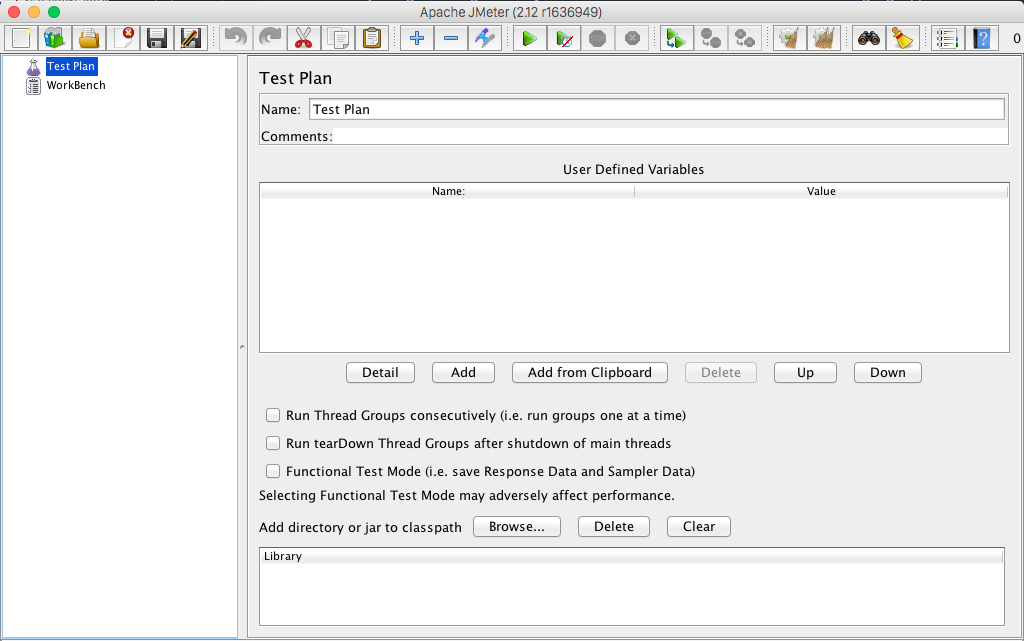
My, that’s a lot of buttons. Fortunately, for us Rubyists there’s a gem, ruby-jmeter which provides a nice, simple DSL for configuring and running JMeter tests. Just $ gem install ruby-jmeter and create a file for our test, jmeter.rb.
#!/usr/bin/env ruby
require 'ruby-jmeter'
We’ll make it executable with $ chmod +x jmeter.rb and run our test with ./jmeter.rb.
The jmeter-ruby DSL
The test block
test do
  defaults domain: 'beta.stevegrossi.com'

  cookies clear_each_iteration: true

  # threads(options) do ...

  view_results_tree
  summary_report

end.run(gui: true)
This block will contain some configuration for the test as a whole: in this case the domain, as well as instructions for JMeter to use a cookie store for each simulated user (just like a browser), which should be cleared after each time a user has gone through our test plan.
The test block will end with either end.jmx, which generates an XML test plan which can be imported into JMeter or shared with your teammates, or end.run to immediately run the saved XML test plan with JMeter. I’ll be running the test plan immediately, though at first with .run(gui: true) to open the JMeter interface in order to see what’s going on.
At the end of the test block, we’ll include some DSL methods for generating reports. JMeter offers many kinds of reports for parsing the data it generates, but I’ve included two of the simplest here. view_results_tree will display all of the requests (and nested sub-requests for linked assets) made in the test, which is useful for debugging. summary_report will show us some overall stats on how our app behaved during the test (more on summary reports here).
Note that reports cost some processing power to generate, and can thus affect JMeter’s ability to generate large numbers of requests. For that reason, you may want to disable these reports (and the GUI entirely) once you have a working load test you’re happy with.
The threads Block
threads count: 10, loops: 1 do

  extract name: 'authenticity_token',
          regex: 'meta content="(.+?)" name="csrf-token"'

  think_time 3000, 2000

  # transaction 'Log In and View Lesson' do
end
Within the test block and after the test-wide configuration, we’ll include a threads block with configuration for each of the concurrent threads (i.e. simulated users) that JMeter will be running. count: 10 tells JMeter to simulate ten users concurrently. The extract block tells JMeter to scan the HTML response for the CSRF token (with a regular expression), a unique string that Rails generates on each request and which will be required to submit form data. While not necessary, think_time introduces a delay between requests (as we did with Siege). The arguments tell JMeter to wait an average of 3 seconds between requests, with a random variance of 2 seconds (so between 1 and 5 seconds) for a given instance.
The transaction, visit, and submit Block
transaction 'Log In and View All Books' do

  visit '/meta/log-in' do
    assert contains: 'Sign In', scope: 'main'
  end

  submit '/meta/log-in', {
    always_encode: true,
    fill_in: {
      'utf8'               => '✓',
      'authenticity_token' => '${authenticity_token}',
      'email'              => '[email protected]',
      'password'           => 'p455w0rd',
      'commit'             => 'Sign In',
    }
  } do
    assert contains: 'Dashboard', scope: 'main'
  end

  visit '/admin/books' do
    assert contains: 'Born', scope: 'main'
  end
end
Within the threads block, we’ll group all of the actions a simulated user should take within a named transaction block. Within this block, we can use a visit block to submit a GET request (i.e. navigating to a page) and a submit block to submit a POST request (i.e. filling out a form). The two examples above will simulate visiting the log-in page and filling out and submitting the log-in form, after which the simulated user within this single JMeter thread will be logged into the app.
Notice that each of these blocks contains an assert declaration. This is a simple way to have JMeter confirm we’re on the right page, by looking for a particular string in the HTML response body. I found these essential when first learning how to set up a test plan. By asserting that we’re on the right page, JMeter will fail early if, for example, authentication fails due to a configuration error and you’re redircted to a different page than you expect to be on. The scope: 'main' option is essential (as I learned the hard way). Without a scope, the assert test will be run against all of the requests and fail if any response (including linked CSS and JS files) does not contain the asserted string. scope: 'main' tells JMeter only to look for the asserted string in the main HTML response.
When submitting POST requests in a submit block, always use always_encode: true, especially when testing Rails apps. At first, I didn’t know to include this, and was baffled when login requests would fail randomly. It turned out that the randomized CSRF token which Rails generates sometimes contains characters that need to be URL-encoded, and sometimes doesn’t. Always encode your parameters and passing the authenticity_token should always work.
Also, unless you’re testing registration (which you may want to do, my site just happens not to allow it), you’ll need to generate valid login credentials for the JMeter user. I’ve already done this through the Rails console.
Running JMeter
I’ve created a Gist of the entire test plan, but please treat this as just an example and don’t actually load test my staging site. (It won’t work in any case, as the test email and password don’t exist.) To run our test with JMeter, just run the Ruby file:
$ ./jmeter.rb
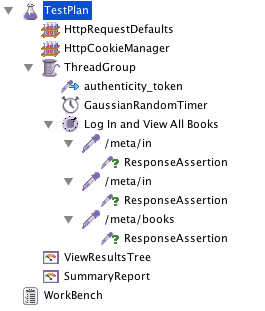
Since we specified run(gui: true), this will open the JMeter GUI, and we’ll have to click the green “Play” arrow to begin the test. But first, we can inspect the test plan we’ve generated with the help of ruby-jmeter’s DSL. Had we not used that gem, we’d have had to build this test plan ourselves using the JMeter GUI.
Now, let’s click the “Play” button to run our load test. Click on the “ViewResultsTree” node in the sidebar to see the requests and responses in real time:
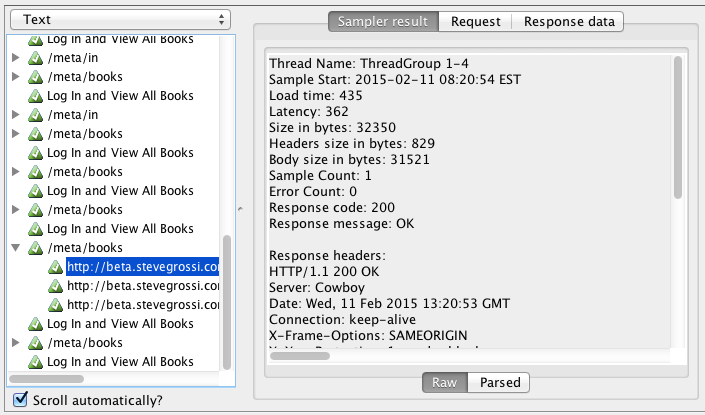
And once the test has completed, we can click the “SumaryReport” node to see aggregate data about this test run, with statistical detail (including standard deviation) on par with Apache Bench.
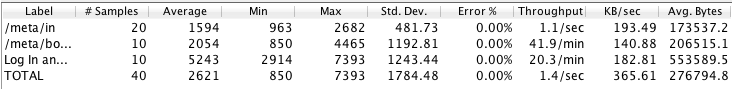
We can use this data as a performance benchmark like we did with Apache Bench, or jump into New Relic to see how the app handled under traffic generated.
Third-party Tools
Finally, it’s worth mentioning that there are some great hosted tools for doing load testing like this. I’ve personally used Blitz.io and Loader.io—mainly because they offer free plans with one-click setup as Heroku addons—and found them both powerful and easy-to-use. One thing I like about Loader.io is that it lets you schedule repeated load tests, so you can begin capturing benchmarks on a daily basis to make sure response times remain consistent or improve. They also have a webhook for integrating load tests into your continuous integration workflow, for example, you could have your CI server deploy to staging, run a load test, and fail if performance degrades by a certain threshold.
Conclusion
I hope this has been a useful introduction to the various kinds of load testing and some of the tools at our disposal as developers. I’ve found load testing to be an important way to learn about how the code I write behaves—not just on my laptop or in integration tests, but in the wild—before my customers learn how it behaves, for better or worse.